Graphing Parametric Functions
In this task we will attempt to graph the all-time favorite physics question about a projectile leaving a launcher to hit a simultaneously falling ball opposite it:
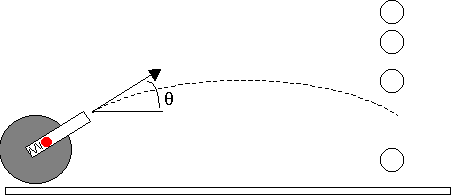
The projectile leaves with a certain velocity V making an angle theta with the horizon, while the other ball is released a distance y0 above and x0 opposite the launcher.
The general equation of motion for this problem are as follows:
for the projectile:
x(t) = V cos(theta) t, and y(t)= V sin(theta) t - 1/2 g t^2
for the (free-)falling mass:
x(t) = x0, and y(t) = y0 - 1/2 g t^2
When and where these two functions intersect -- that is when and where the projectile hits the ball.
The parameters in this problem will be set at:
V = 5 m/s
theta = 45°
x0 = 1 m
y0 = 1 m
and g = 9.807 m/s^2
1. Since we wish to graph a parametrc function and not a sequence, for example, we first need to make sure the calculator's graphing mode is set to parametric graphing. The mode setting is in the MODE screen. Press the MODE button now.
See the "Graph.............. PARAMETRIC" setting? This is the correct setting we need right now. Confirm by pressing ENTER.
? It doesn't say PARAMETRIC. What do I do?
Ans If your calculator says otherwise, such as FUNCTION or POLAR or any other listing, you will need to change it to PARAMETRIC. Use the right arrow while on the Graph line (as indicated above) and choose PARAMETRIC:
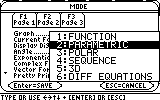
Confirm by pressing ENTER to save your settings.
2. Now we need to enter our functions in the calculator's "To Do" list of function graphs.
Open the Y= editor by pressing DIAMOND+F1.

Your Y= editor may show one or more functions already entered. We will need just two of the parametric function entries free. You can scroll down to a free entry or delete one of the occupied entries using the CLEAR button or the Backspace button while the highlight is on the occupied line.
Each entry in this context refers to both xt# and yt# for the same #. A function is not complete unless both of the entries are filled. In other words, just trying to graph this:
xt1=cos(t) t^2
yt1= [nothing]
will result in an empty plot. (Think about it: in normal y(x), every 'x' determines a 'y', while in parametric every 't' determines an 'x' and a 'y'. Otherwise, there is no 2D plot to draw!)
In this example we will use (xt1, yt1) and (xt2, yt2).
On the first xt# line (here xt1), type the x(t) of the projectile:
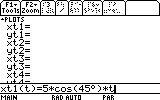
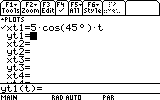
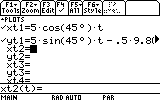
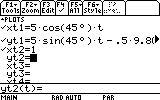
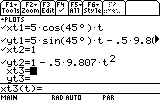
3. Press DIAMOND+F2 for the WINDOW screen. This is where we set the boundaries of the graphed area. Your WINDOW screen setting probably shows different numbers, but as we have learned, this is not an obstacle for us: any setting can be easily changed to suit out needs.

First, 'tmin' is the first value of t used to graph. 'tmax' is the last value of t used to graph, and t in incremented by value of 'tstep'.
Normally, 'tmin' < 'tmax', and then 'tstep' > 0, but also the following setting is valid: 'tmin' > 'tmax', and then 'tstep' < 0. In any case 'tstep' cannot be 0.
In our example, since t represents time, it will begin from 0, so let's set 'tmin' to 0. Highlight the 'tmin' line and type 0, followed by ENTER to confirm your entry.
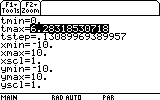
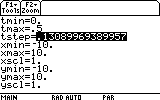
The next important setting is the 'tstep'. Since we would like the graph to be smooth as possible (in minimum graphing time, of course), we could set 'tstep' to 0.02.
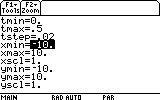
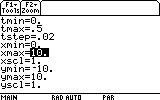
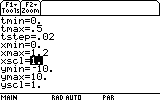
The 'xscl' setting sets the number of tickes on the horizontal axis. We do not need this set at any particular value right now. Let's leave it as it is.
In the vertical direction, the ball and the launcher are also 1 m apart. Let's set the vertical range (ymin..ymax) to 0..1.2 as well.
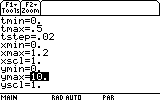
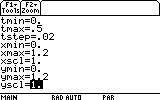
As before, we just leave the 'yscl' parameter unchanged.
The next step is simply to graph these two functions. Press DIAMOND+F3 now.
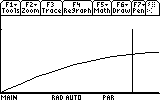
There is obviously a potential interception point there, but we still cannot tell if the ball and the projectile were at that point at the same time too (i.e. they both pass through this point, but not necessarily at the same time, and therefore do not actually meet).
Finding whether this point is an a real interception means solving the equations and verifying that the same t satisfies the same point for both bodies. However, this is our purpose here. Instead, we could try to see these graphs in a different way - animated. This animation will show more or less where we stand.
So -- we go back to the Y= Editor, by pressing DIAMOND+F1. Here we can change the way these graphs are plotted.
If you have not done so already, press DIAMOND+F1 now.

We are back in the Y= Editor. Look at the F6 menu: it says "Style". This is where we change the way our graphs are plotted.
Highlight one of the first functions for the projectile (here xt1 or xt2) and press F6 now (TI89: 2nd F1)
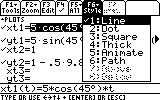
The current setting is Line. We would like to animate the graph. Choose item
5. Animate
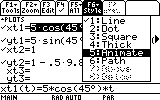
and press ENTER.
Now highlight any one of the ball functions (here xt2 or yt2), and open the Style menu again.
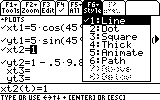
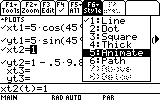
Before graphing, we'd better change also the order in which the graphs are plotted. This can be sequential or simultaneous. We need simultaneous.
To change this setting press DIAMOND + | [the with/when button]. This brings up the following dialog box:
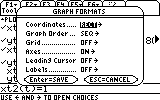
In this dialog box we can change the setting for Graph Order.... from sequential (SEQ) to simultaneous (SIMUL).
Scroll to Graph Order and press the right arrow key.
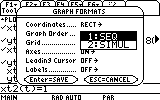
We need SIMUL. highlight it...
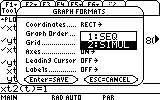
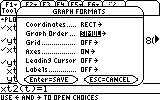
What if the initial velocity V had been not 5 m/s but 7, 6 or 4 m/s? Would the projectile hit the ball now? (The point is to go back to the Y= Editor, change the numbers and see the outcome). Would this happen with V = 3 m/s also? Would the projectile hit the ball with V=5 m/s but with theta = 40 degrees instead of 45? (Change the corresponding values in the Y= Editor and run the simulation again : )