Plotting Data Points
In some chemical rocket
propulsion applications, two main components are involved:
the one is the oxidizer, and the other the fuel. Each of these materials may
be introduced into the combustion chamber in any quantity, but the ratio may
not be stoiciometric that way. This calls for the designer to find a way to
predict what the final flame temperature will be (assuming adiabatic flame,
of course) and the composition of the exhaust gases produced, in equilibrium.
Naturally, the purpose of this task is not to teach you how to estimate adiabatic flame temperature.
In the process of calculation, the solution produces two sets of values, temperature vs. epsilon (which we will designate as E), which is actually a delta-molar quantity with which the designer knows what the equilibrium ratio is. Each set has 4 data points, and represents a line. Those two lines are plotted and their intersection will be the approximate adiabatic flame temperature and its matching delta-molar quantity.
Thus we have:
Set 1 Set 2
E Temp
E Temp
-----------------
-----------------
E1 T1 E5
T5
E2 T2 E6
T6
E3 T3 E7
T7
E4 T4 E8
T8
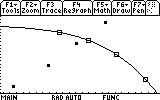
We will plot these sets. Each set is a line (not linear, don't worry). We
will then fit a curve to each set, and find their inetersection graphically.
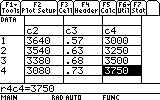
From my final exam, this is the data finally reached at:
Set 1 -- 1:(0.65, 3640) 2:(0.70, 3540) 3:(0.75, 3380) 4:(0.80, 3080)
Set 2 -- 5:(0.57, 3000) 6:(0.63, 3250) 7:(0.68, 3500) 8:(0.73, 3750)
(The temperature is in Kelvins, in case you were wondering)
Are you ready to plot?
The data points we have need to be saved somewhere on your calculator. While there is more than one way to do this, the most convenient and straightforward way is to use your Data/Matrix Editor.
First, we need to open a new data variable, in which we could save our data
points.
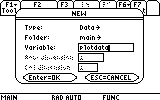
Press the APPS button, and choose to open a new Data/Matrix Variable:
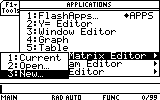
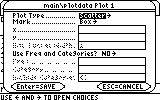
Scroll down to the Variable field and type the name "plotdata".
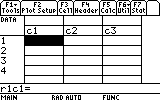
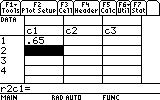
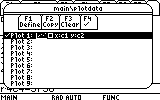
This is the editor. Each cell has a reference label. The first is r1c1. This is the one we are highlighting now. You can move around with the arrow keys and see the other cells. Right now they are all empty.
? This is a little confusing. Where do I start writing the data points from?
Ans In some commercially avaliable programs, this doesn't matter. Writing the data points horizontally like this:
x1 x2
x3 ...
y1 y2 y3 ...
or vertically, like so:
x1 y1
x2 y2
x3 y3
...is basically the same, because later you can choose in which direction the data is.
However, the calculator's editor has only one readable direction: vertically. See the c1, c2, c3, ... headings over each column? This is the logical setup of the data variable. In other words, the data variable contains the columns c1, c2, c3 etc and not the rows 1, 2, 3 etc.
? But why would it matter to me how the calculator saves the data points?
Ans
Simple
-- because of the way you later need to recall them.
In order to plot, you will be asked to give a list of x-values and a list
of y-values.
This means you have to give two columns, as in the vertical
setup, and cannot give two rows, as in the horizental
setup, because of the way the data variables are stored.
Back to our task, we start entering all the values into the editor. Highlighting the first cell, r1c1, we simply type in the first value, E1, 0.65:
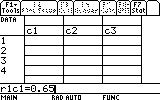
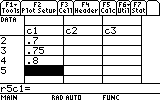
Continue this way until you have enteredall of the first set's E values, E1..E4.
To make the preliminary data plots we need (not the curve fitting yet), we must follow these simple steps:
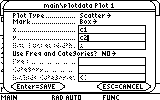
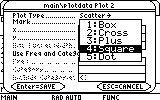
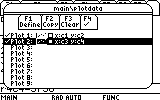
1. To define the first set's graph: press F2. On the "Plot 1:" line press F1.
Leave the settings on Scatter and Box. This means that the plot will make only points marked with a box. (nother option is to make an xyline, which will connect the points. But we don't want that. That is a very crude fitting of the curve).
In the x ....field enter the first x-values column: "c1"
In the y ... field enter the first y-values column: "c2"
... and enter c3 and c4 as the second set's x-values and y-values lists respectively:
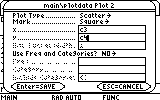
Confirm and the second plot is ready.
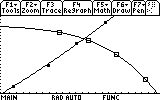
3. Before we see the plots, we would like to make sure that nothing else is in the plotting "to-do" list (or "que"). Let's go first to the Y= Editor, and check that no function is selected (marked for plotting). It is better that no other function be present at all since, as explained in the task "Plotting Functions", any written, even if not selected function is evaluated, thus slowing down the excution of everything else.
After checking that, we need to set the window limits. In this particular case this is very easy -- there is an option in the Zoom menu called ZoomData. This option will inspect the limits of our data for min and max and adjust the window limits by itself. This is extremely convenient. Therefore, open the Zoom menu by pressing F2 and select 9:ZoomData. This is what you'll see:
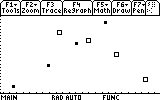
You can "Trace" the individual data points by pressing F3 and the arrow keys.
In any case there is indeed an intersection point. We would like to find this intersection point as accurately as possible. For this purpose we will now fit this data am analytic expression.
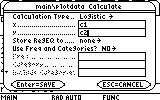
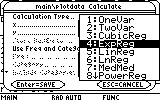
In the Data/Matrix Editor choose the Calc menu (F5). This is the dialog box from which we activate the curve fitting models.
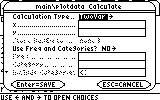
The "Calculation Type..." line indicates which regression model to use. Scroll down to Logistic and press ENTER.
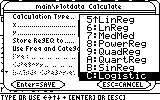
? Wait a minute! Hold it! How did you know which regression model to choose?
Ans This is largely a matter of experience. The first type of data has an ineteresting problem. It would not respond well to Exponential nor Logarithmic regression models. The only model which works beautifully on this set of data is the Logistic model. the problem with the logistic model is that it takes quite a while to calculate. You could also try the CubicReg model, i.e. a cubic regression model. This would take a lot less time to calculate, but it will give a good fit only within the boundary of these four data points. Before (to the left of) them and after (to the right of) them the fit will have a large error. This is why I did not choose the cubic regression.
If you want to know what expression every regression produces, please refer to your manual under the appropriate chapter.
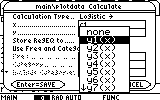
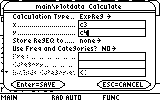
We would also like to save the resulting expression in the Y= Editor. For this purpose choose "y1(x)" in the "Store RegEQ to..." field:
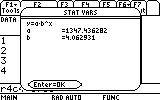
After you press the ENTER key twice to confirm this dialog box, you will have to have a little patience, until the calculator finishes calculating the regression formula. Most regression formulas are quite fast. This regression type is slow because its analytic expression is non linear and difficult to solve.
In any case, after a minute or so you will see the resulting coefficients:
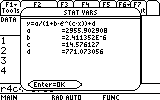
As you can see, the effort payed off. We have a beautiful fit to this set of data points (as those of you who know a little about numerical analysis will forgive me for the free use of the unprofessional expression "beautiful" here... : )
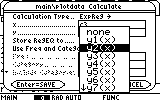
Next, we would like to fit an analytic expression to the second set of data. Luckily, this set behaves much better than the first one. A simple ExpReg, i.e. exponential regression will suffice. Open the cal menu again (F5) and choose ExpReg from the Calculation Type field.
Next fill in the appropriate x-values and y-values of the second set, c3 and c4...
Confirm this dialog box and in a short while the results appear:
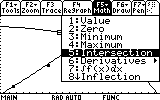
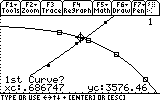
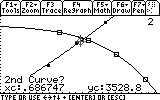
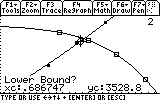
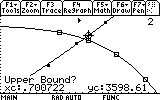
Finally, we complete this task by finding that illusive point of intersection, by choosing 5: Intersection from the F5 menu: Math.

_____________________________________________________________________________________
Created by Andrew Cacovean, Nov. 16, 2001