Graphing Polar Functions
Suppose we wish to graph the elliptic orbit of a small planet around a larger one. The corresponding equation for the elliptic orbit is of the form:
r (theta) = p / (1 + e cos(theta) )
This is a polar function, where each angle 'theta' determines a radius 'r', where 'p' and 'e' are constant parameters for the particular orbit.
The small planet revolves around a larger planet of radius R.
To make this example easy to follow, we should choose some 'conovenient' values for R, p and e. Normally, p is very large, and so is R. We will, however, choose the following parameters:
R = 1.5
p = 4.5 (to have an ~ x4 ratio)
and e = 0.7 ( e is always 0 < e < 1 for elliptic orbits)
? It doesn't say POLAR. What do I do?
Ans If your calculator says otherwise, such as PARAMETRIC or 3D or any other listing, you will need to change it to POLAR. Use the right arrow while on the Graph line (as indicated above) and choose POLAR:
Confirm by pressing ENTER to save your settings.
2. Now that we have "told" our calculator that we wish to graph functions of the form r(theta), we can enter our function in the Y= editor.
Open the Y= editor by pressing DIAMOND+F1.
Your Y= editor may show one or more functions already entered. We will need just two of the r#'s free. You can scroll down to a free r# or delete one of the occupied r#'s using the CLEAR button or the Backspace button while the highlight is on the occupied line.
Either way, with the highlight on an empty r# line, enter the first equation, which is the outline of the larger planet, r = 1.5
Now we enter the second equation, which is the elliptic orbit of the smaller planet.
On the second free r# entry, type 4.5/(1 + 0.7 cos(theta)) ...
Notice that the newly entered r# is tagged (or selected). If there are any other selected r# in your Y= editor, deselect them by highlighting them and pressing F4. If you leave another r# selected, the calculator will graph it too. They may overlap, take longer to graph, and complicate other actions. Make sure only our expression is selected before we continue.
3. Next we proceed to set the limits of the plotting window. To make this particular function "look good" (i.e. take up most but not all of the screen, be in reasonable proportion and not distorted...) it is necessary to experiment a bit. Since this is only an example, the correct setting are provided here. In any other case the user must either know in advance how to size his/her plotting window ranges, or be patient and experiment until the plot "looks good" (this is valid for any type of plotting).
Open the WINDOW screen by pressing DIAMOND+F2
Your WINDOW setting may show other values, but as always these values can be easily changed to suit our needs.
The first value to set is 'thetamin'. We wil set this to 0 (zero). In the 'thetamin' entry line type 0 ...
Next set the 'thetamax' setting to 6 times Pi. In the 'thetamax' entry line type 6Pi...
? Why 6 times Pi?
Ans As mentioned before, this problem is not very intuitive to graph. It needs a bit of trial-and-error to set the right graphing range. After a bit of experimentation, I have determined that this is the most convenient range for graphing this particular problem. Every problem is different, and may require some patience in setting the graphing range before the graph could be said to "look good".
The next parameter to set is 'thetastep', which is the increment by which to increase the value of theta when graphing is performed. It is usually set at Pi/24 = 0.130 899 693 ...
If this is not what your WINDOWS setting shows, change it to Pi/24 or just make it 0.13.
? Err... What the...?
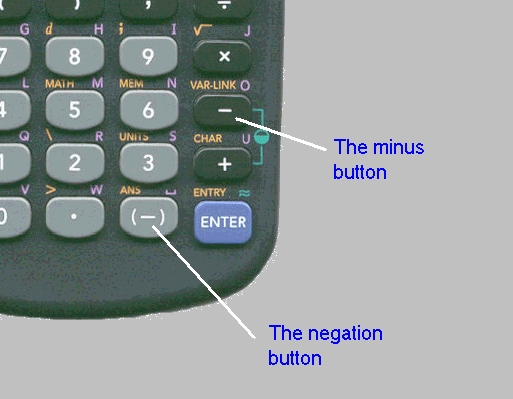
Ans If you tried to type '-16' and got the above error message, then you've simply made the classical mistake of confusing the minus sign and negate.
The minus sign is a simple '-', and it's the function key above the '+'and below the 'x' (multiply) key. It performs the substraction operation.
The negation key is a shorter '-', and is the key between the '.' and the ENTER keys. The negation is used only to negate a variable or number (i.e. make it negative if it is positive or make it positive if it is negative). It does not stand for substraction, and vice-versa -- the minus key only substracts and does not stand for negation. Since you typed '-16' with a normal minus, the CAS is asking where the second operand is, since substraction requires two operands!

The last thing we need to do is set the right plotting style. We want the larger planet's outline to appear as a line, while the smaller planet to animate it's path around the larger planet. Thus we return to the Y= EDITOR screen by pressing DIAMOND+F1
We need the style to be 'line' and it is 'line' (simply because this is the default setting). Simply press ESC to leave the current setting active.
Next we look at the orbit equation's style: highlight the orbit's line, and press F6 (DIAMOND+F1)
We need the orbit's plot to be animated, therefore we choose
5. Animate
Since the Graph Order .... setting is set to SEQ (sequential), we may leave without changing anything by pressing ESC.
Finally we can see the animation by going to the GRAPH screen. Press DIAMOND+F3 now.